Key Takeaways
Yield curve reveals the bond market’s economic outlook
Yield curve inversions often project an eventual recession
Inversion doesn’t immediately end the bull market
Happy April Fools’ Day! The first quarter of this year was no joking matter for investors. While the escalation of the Ukraine-Russia conflict has increased volatility (and caused commodities to soar), expectations of the pace and magnitude of the Federal Reserve’s (Fed) tightening cycle has ratcheted up market tensions. On one hand, there are calls for the Fed to be more aggressive to tame inflation. On the other, there are concerns that the US economy will not be resilient enough to withstand higher borrowing costs. And with the market weighing these outcomes, the yield curve (2-year vs. 10-year Treasury yield) flirted with inversion for the first time since 2019. While there are many parts of the yield curve, we’ll address the potential significance and impacts investors should consider.
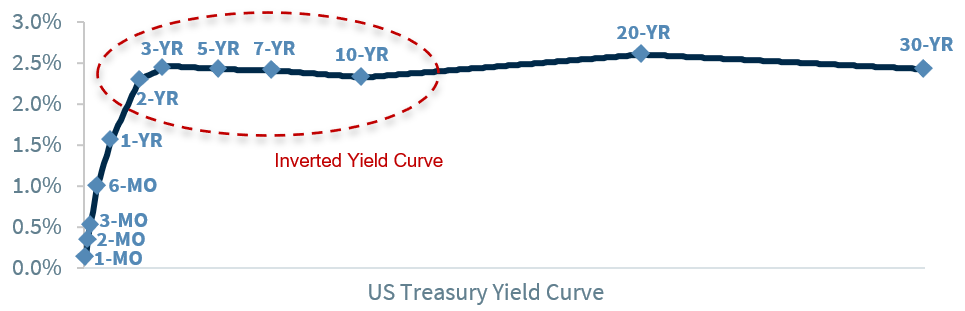
Time To Get Serious About The Yield Curve Inversion | The shape of the yield curve gives the bond market’s expectations of the direction of the economy. In general, the Treasury yield curve is the plotting of interest rates (vertical axis) versus an increasing maturity structure (horizontal axis). When the yield curve is upward sloping (e.g., the longer the maturity, the higher the yield), it tends to portend a healthy and expanding economy. When the yield curve is downward sloping and inverted (e.g., longer maturity yields are lower than shorter maturity yields) it tends to suggest slower, or even potentially contractionary, economic conditions. While the full Treasury yield curve has not inverted yet, portions of it have, or have flirted with inversion. The reason this is important is simple: inverted yield curves have had a good record of anticipating an eventual recession. The confusion: which yield curve relationships to monitor as not all of them have inverted. For example:
3-Month – 10-Year Spread: A Measure Of What Has Been Done | The 3-month yield is indicative of where the fed funds rate stands currently. The 10-year Treasury tends to be a reflection of the longer-term strength of the economy. And since the Fed has only implemented one 25 basis point hike thus far, this spread remains wide at 180 basis points—far from inverting. This metric, which is a key dynamic the Fed monitors, has the longest track record and been successful anticipating recessions—it has inverted prior to the last eight recessions (back to 1970).
2-Year – 10-Year Spread: A Measure Of What Will Be Done | This relationship captures the most media attention as the 2-year Treasury yield anticipates future Fed moves during a tightening cycle while the 10 year reflects the longer-term strength of the economy. With the market pricing in an increasingly more aggressive tightening cycle (8+ more Fed hikes by year end), this relationship has flirted with inversion this week as the 2-year yield has proportionately moved higher. Despite its shorter track record, it has similarly been successful in foreshadowing the last six recessions (back to 1980).
Don’t Get Fooled If The Yield Curve Does Invert | We don’t have a ‘favorite’ yield curve metric as both provide valuable insights. But as it appears the 2-year/10-year Treasury curve is facing an imminent inversion, we’ll share our insights. To be clear: the inversion of the yield curve is not synonymous with the economic expansion and equity bull market coming to a screeching halt. Rather, while the yellow ‘caution’ flag may be out, history suggests that both may still have further to run.
What Happens To The Economic Expansion? | The spread between the 2-year and 10-year Treasury yields has inverted prior to the last six recessions, but it is important to acknowledge the lead time of this signal. In fact, history suggests that the economy has continued to grow, on average, for an additional 18 months before experiencing a recession. And given that the majority of our preferred recessionary barometers—sales growth, jobless claims, building permits, consumer confidence, and leading economic indicators—favor the continuation of the expansion, a recession is not our base case over the next twelve months. Our expectation for above-trend growth (2022 GDP estimate: ~2.5%) has not changed.
What Happens To The Equity Bull Market? | As the eventual inversion of yield curve will call into question the longevity of this bull market, history is on the side of a continuation. Since 1978 (seven inversions), the S&P 500’s average performance in the 12 and 24 months following the inversion date has been 11% and 16%, respectively.* Even better, it has been positive more than 70% of the time over both of these periods. The upcoming Q1 earnings season, set to begin in just under two weeks, will be critical in determining whether or not the economy is slowing precipitously. While higher commodity prices will pose a concern, strong consumer spending and a sustained reopening should reassure investors that S&P 500 earnings growth can remain above average and grow ~9% in 2022.
For a more in-depth discussion of the above and other topics like fixed income, commodities, energy, and more, please join us for our 2Q22 Quarterly Coordinates webinar titled ‘Come Together’ this Monday, April 4 at 4PM.